News / All News / Article

Penguin Case Study | Building an OTC Data Analytics Framework for a Leading Pharmaceutical Company to Drive a 35% Increase in Sell-Through

Article images may contain Chinese text.

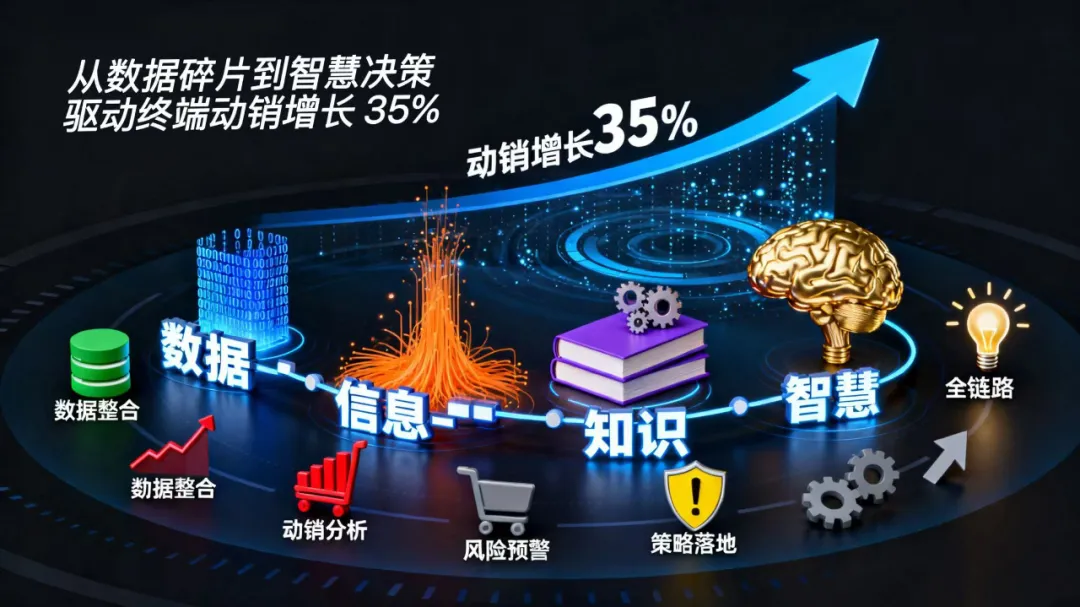
When pharmaceutical companies in the OTC retail market seek to systematically analyze market data and increase outlet sell-through, they often encounter fragmented data, superficial analysis, and disconnected strategies. This makes it difficult to use data to support outlet sell-through decisions and impedes growth. Using a project to build an OTC retail market data analytics framework for a leading pharmaceutical company, Weiming Penguin shares how the journey from fragmented data to informed decision-making drove a 35% increase in outlet sell-through.
Image

When pharmaceutical companies in the OTC retail market seek to systematically analyze market data and increase outlet sell-through, they typically face three core challenges:

1. Fragmented data: Outlet sales data is scattered across distributor ERP systems, pharmacy POS terminals, and O2O platforms, with no unified integration. Chain pharmacy data must be downloaded manually, while data from independent pharmacies depends on sales representatives taking handwritten notes during store visits. The resulting data lag prevents real-time visibility into outlet sell-through;

2. Superficial analysis: Companies can only compile basic figures such as “a given pharmacy sold XX boxes this month.” They cannot answer critical questions such as “Why are sales declining at this pharmacy?”, “Which outlets are at risk of churn?”, or “Which region should receive additional stock next month?” Decisions rely on experience rather than data;

3. Disconnected strategies: Marketing promotions do not match actual outlet demand. For example, a community pharmacy may offer a large discount for purchases above a high spending threshold, even though its customers primarily make small, frequent purchases. Promotion redemption rates fall below 20%, resulting in substantial resource waste.

To address these challenges, Pharmaceutical Company X adopted the transformation from “data to information to knowledge to wisdom” as its core logic. Combined with the classic business analytics progression of description, diagnosis, prediction, and decision-making, it built an OTC retail market data analytics framework spanning the entire chain from outlet coverage and sell-through analysis to risk alerts and strategy execution.


Penguin's Solution
Image

Image


(1) Data Integration — Breaking Down Information Silos and Building a Solid Data Foundation
Image

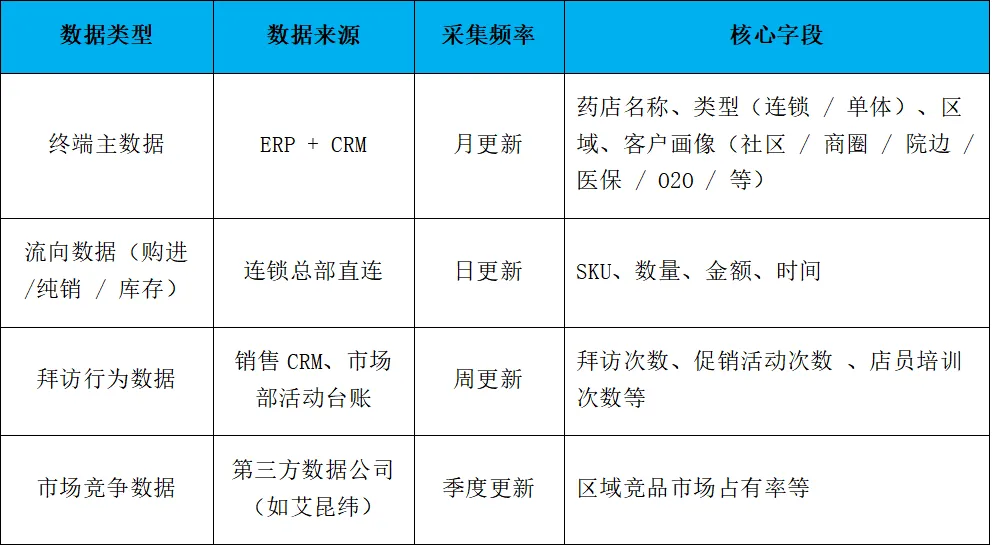
Using a combination of unified master data, automated data collection, API integration, and manual imports, Weiming Penguin integrated four core categories of data to build a unified OTC retail data platform for the client:

Image

After the data platform went live, Pharmaceutical Company X achieved consistency in three areas: data standards (for example, defining a “chain pharmacy” as “a retail enterprise with ≥10 stores”), update frequency (core sales data is available on the same day), and access permissions (regional managers can view only data for their own regions, while headquarters can view nationwide summaries).

Image
Image


(2) From Data to Information — Describing “What Happened” with a Focus on Core OTC Outlet Scenarios
Image

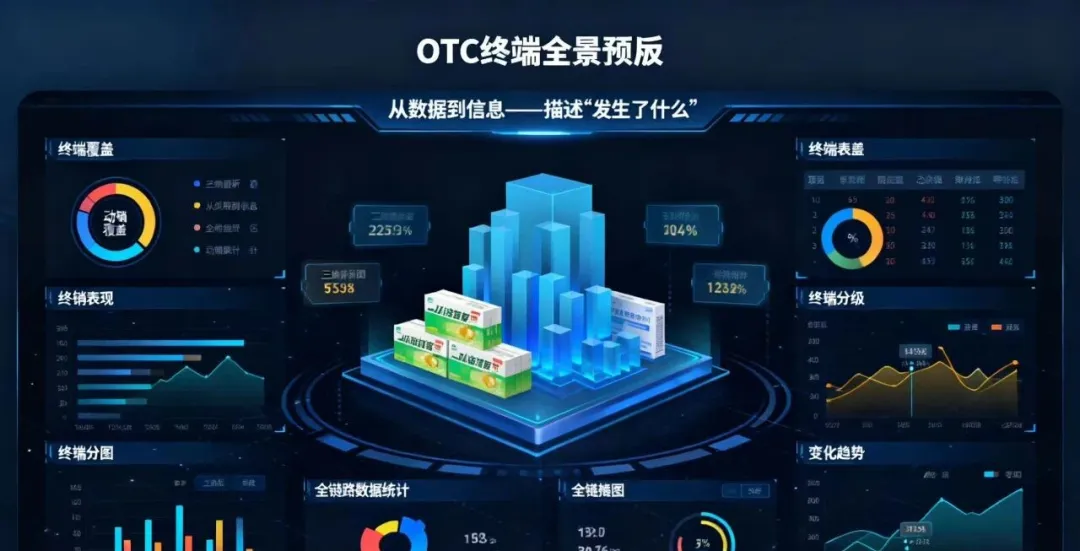
Built on the data platform, Penguin Zhongduantong provided Pharmaceutical Company X with a panoramic OTC outlet dashboard. It turned raw data into understandable information across four dimensions—outlet coverage, sell-through performance, outlet tiers, and trends—to answer the question “What happened?”:

Image

1. Outlet coverage statistics:

Break down coverage by type, region, and product. For example: “In May 2025, among 680,000 retail outlets nationwide, chain pharmacy coverage across all products reached 280,000 outlets (41.2%). Within this, Product A's coverage among chain pharmacies reached 72% in East China but only 35% in Northwest China;

2. Outlet sell-through performance:

Compile end-to-end data on purchases, sell-out, and inventory. For example: “In May, a community chain pharmacy purchased 100 boxes of Product A, sold 85 boxes, and held 15 boxes in inventory, with an inventory turnover ratio of 5.7 times (above the national average of 4.2 times), classifying it as a high-sell-through, low-inventory outlet”;

3. Outlet tiering and activity assessment:

Score outlets based on purchase volume (30%), sell-out growth rate (40%), and promotion participation (30%), and classify them into Tier A (core, top 20%), Tier B (important, middle 60%), and Tier C (basic, bottom 20%). For example: “XX Pharmacy in Beijing's Chaoyang District (Tier A) achieved 45% sell-out growth in May and participated in three promotions, making it a priority for resource allocation”;

4. Outlet trends:

Track the numbers of new, lost, and high-value outlets. For example: “From January to May 2024, 3,200 partner outlets were added nationwide (78% of them chain pharmacies), while 800 outlets were lost (mostly independent pharmacies in remote areas). The number of Tier A outlets increased from 8,000 to 9,200, a 15% increase.”

5. Online and offline price monitoring:

Using multiple data acquisition methods and integrating AI into a range of business scenarios, monitor pricing data on e-commerce and O2O platforms to maintain orderly markets and a healthy pricing structure. This includes monitoring unauthorized cross-region distribution online and offline, competitor products, and abnormal prices.

Image


(3) From Information to Knowledge — Diagnosing “Why It Happened” and Identifying Causes and Lessons at OTC Outlets
Image

To investigate identified anomalies, Zhongduantong established an OTC outlet diagnostic model. Through dimensional breakdowns, comparative analysis, and links to behavioral data, it uncovered underlying causes and developed reusable knowledge:

Image

1. Root-cause analysis of outlet churn:

Break down lost-outlet data by region, type, and product, and connect it with behavioral data. For example: “Of the 800 outlets lost in May 2024, 60% were independent pharmacies in Northwest China. The main reasons were that Product A's supply lead time was as long as seven days (versus an industry average of three days) and that they had received only one visit in the previous three months (against a target of two). Competing products could be supplied to all these outlets within three days, making pharmacy staff more inclined to recommend them”;

2. Outlet churn risk alerts:

Set risk indicator thresholds so that the system automatically issues an alert whenever an outlet meets any of the following conditions: sell-out declines by ≥10% for three consecutive months, no purchases for three consecutive months, or fewer than one visit per month.

3. New-outlet analysis:

Focus on the shared characteristics of high-value new outlets (Tier A). For example: “Of the 3,200 newly added outlets, 28% became Tier A outlets. They shared two characteristics: being located in communities with a high prevalence of chronic diseases and receiving ≥3 visits in the first month. Their staff had also all attended one product training session”;

4. Sharing successful practices from high-value outlets:

Extract best practices from Tier A outlets. For example: “The top 100 Tier A outlets nationwide receive an average of 4.5 visits per month and participate in two promotions per quarter, with sell-out growth rates 28% higher than those of ordinary outlets.” These lessons were compiled into an Outlet Operations SOP and rolled out nationwide.


Image


(4) From Knowledge to Wisdom — Predicting “What Will Happen,” Deciding “What to Do,” and Implementing OTC Outlet Strategies
Image

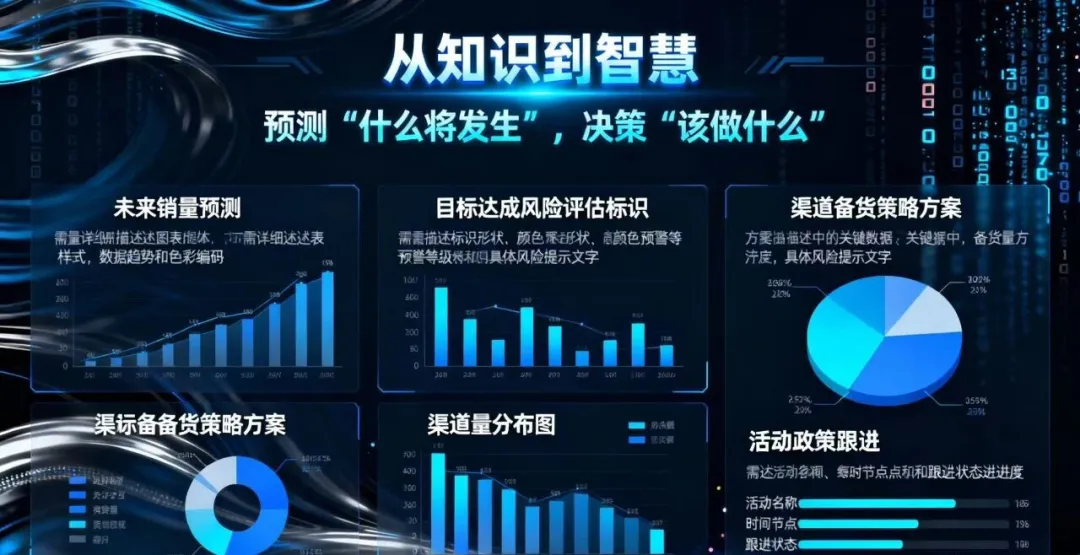
Drawing on knowledge gained through diagnosis, Pharmaceutical Company X used Penguin Zhongduantong's sales forecasting model and strategy recommendation engine to move from experience-based to data-driven decisions:

Image

1. Outlet sell-out forecasting:

Build a machine learning model, such as XGBoost, combining historical sales data (60%), the competitive landscape and market trends (20%), and promotions (20%) to forecast sell-out for the next three months;

2. Assessing the risk of missing targets:

Compare forecast sales with monthly targets to identify at-risk regions, develop targeted channel policies, and prepare contingency plans in advance with pharmaceutical distributors and pharmacy chains;

3. Channel stocking strategies:

Develop differentiated stocking plans based on inventory turnover and sell-out forecasts. For example: “For Tier A outlets with high sell-through, stock forecast sales × 1.2; for Tier C outlets with low sell-through, stock forecast sales × 0.8,” avoiding excess inventory or stockouts.

4. Following up on promotional policies:

Deliver targeted activity plans and promotional strategies to address issues identified through diagnosis.


For OTC pharmaceutical companies, a data analytics framework is not just a tool for viewing data, but an engine for outlet growth. By progressively transforming data into wisdom, it can turn every pharmacy into a high-value outlet with strong sell-through and retention, ultimately building a competitive moat in the fiercely contested retail market. If your company also faces difficulties integrating outlet data, diagnosing sell-through performance, or putting strategies into practice, please contact us.

2025318