News / All News / Article

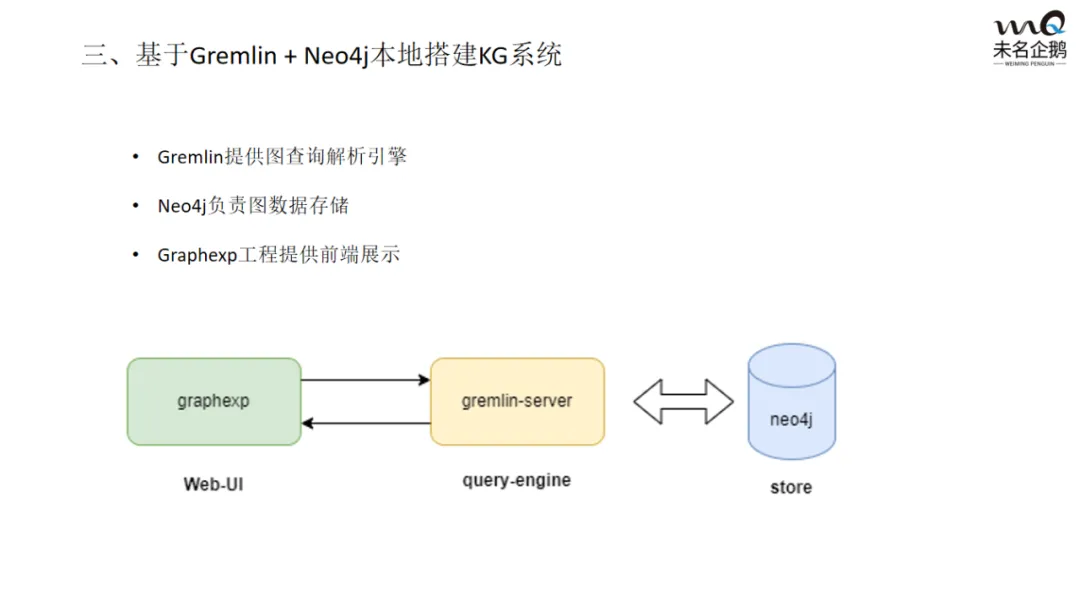
Penguin Geeks | An Overview of Knowledge Graph (KG) Applications and Construction Methods

Article images may contain Chinese text.

As digitalization accelerates across the pharmaceutical industry, knowledge graphs have become a core tool for connecting data with business decisions. Recently, Weiming Penguin's geek expert BOB delivered a presentation on knowledge graphs (KG) on Penguin Geeks, the company's internal technical knowledge-sharing platform. It explained the underlying technical logic and examined implementation scenarios in pharmaceutical retail, supply chains, and other areas where Weiming Penguin has extensive service experience, providing an end-to-end reference for technical and business professionals in the industry. Below is an overview of the presentation's key points.

Image
I. Research Scope and Basic Concepts: Understanding the Underlying Logic of Knowledge Graphs

Image
Image

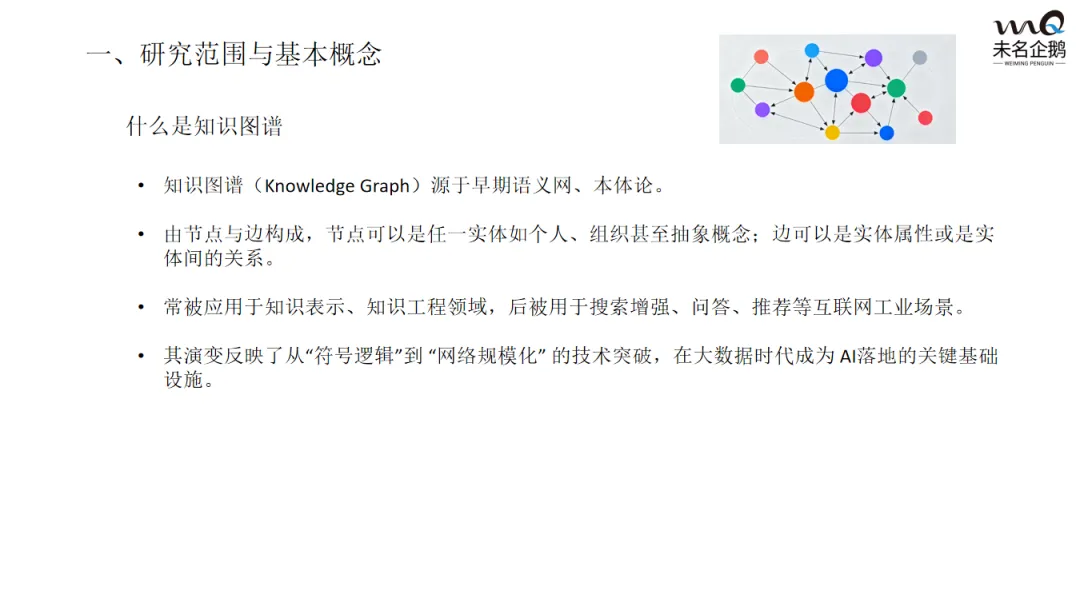
Rooted in the Semantic Web and ontology, knowledge graphs serve as the core data foundation for Weiming Penguin's services to industry clients. Their basic logic must first be understood before they can be adapted to business needs.
Image

1. Core Components and Industry Application Scenarios

At its core, a knowledge graph is a network of nodes and edges, focused on relationships within industry operations:

• Nodes: Industry-specific entities such as supermarket chains, product SKUs, and shipment tracking numbers;

• Edges: Describe relationships, such as “supermarket—stocks—milk,” and also carry business attributes, such as stocking time and inventory quantity.

The applications align with Weiming Penguin's business: in retail, a user–product–supplier graph supports precise replenishment; in supply chains, an order–logistics–warehouse graph locates breaks in fulfillment; and in risk management, a company–legal representative–transaction graph identifies partnership risks.


2. Three Dimensions of Knowledge Representation, Adapted for Industry

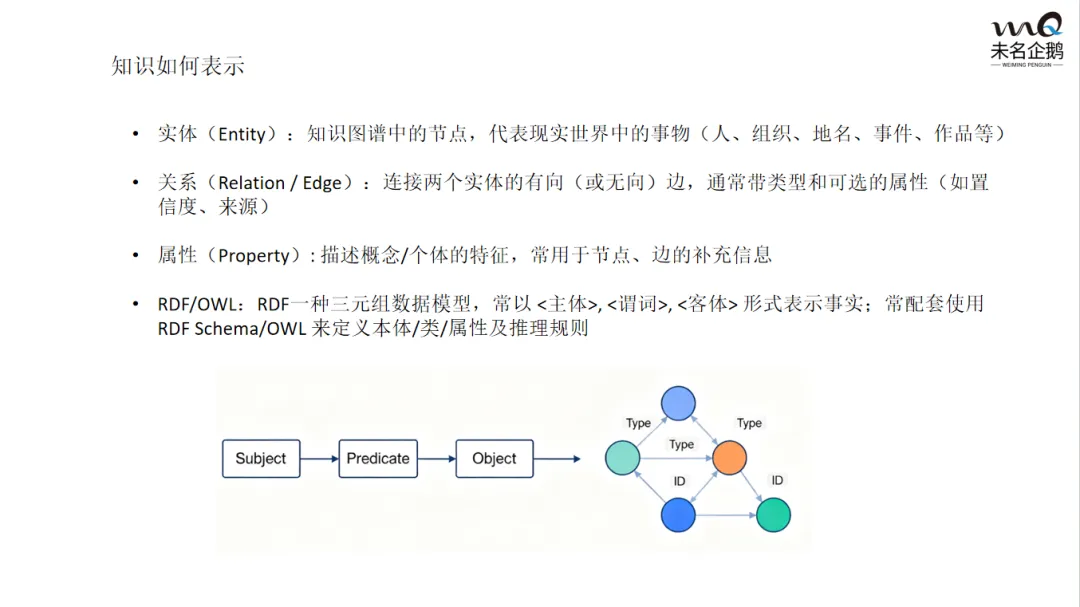
The three core elements reflect business logic rather than purely technical definitions:

• Entities: The objects that carry business data, such as stores in retail and warehouses in supply chains;

• Relationships: Business connections, such as “store—stock transfer—warehouse” and “product—belongs to—category”;

• Attributes: Key elements of business analysis, such as “product—unit price: RMB 59” and “stock transfer—date: month X, day X, 2024.”

Technically, RDF triples (<subject>, <predicate>, <object>) store business facts, while OWL defines business rules, such as timeliness standards for fresh-food stock transfers.
Image

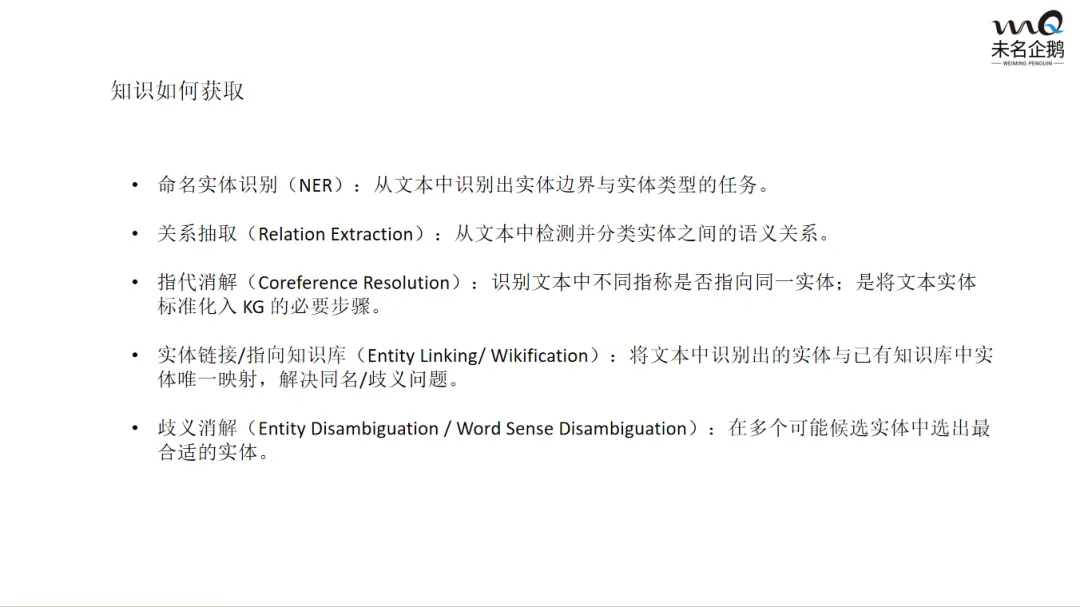
3. Five Main Approaches to Knowledge Acquisition

These form the foundation for building knowledge graphs and help ensure data quality:

• Named entity recognition: Label entity types, such as “Tencent—organization”;

• Relation extraction: Extract semantic relationships between entities, such as “Tencent—headquarters—Beijing”;

• Coreference resolution: Identify references to the same entity, such as “Tencent” and “the company”;

• Entity linking: Distinguish entities with the same name, such as “Lu Xun, the writer” and “Lu Xun's Hometown”;

• Disambiguation: Determine an entity's meaning, such as whether “apple” refers to the fruit or the company.
Image


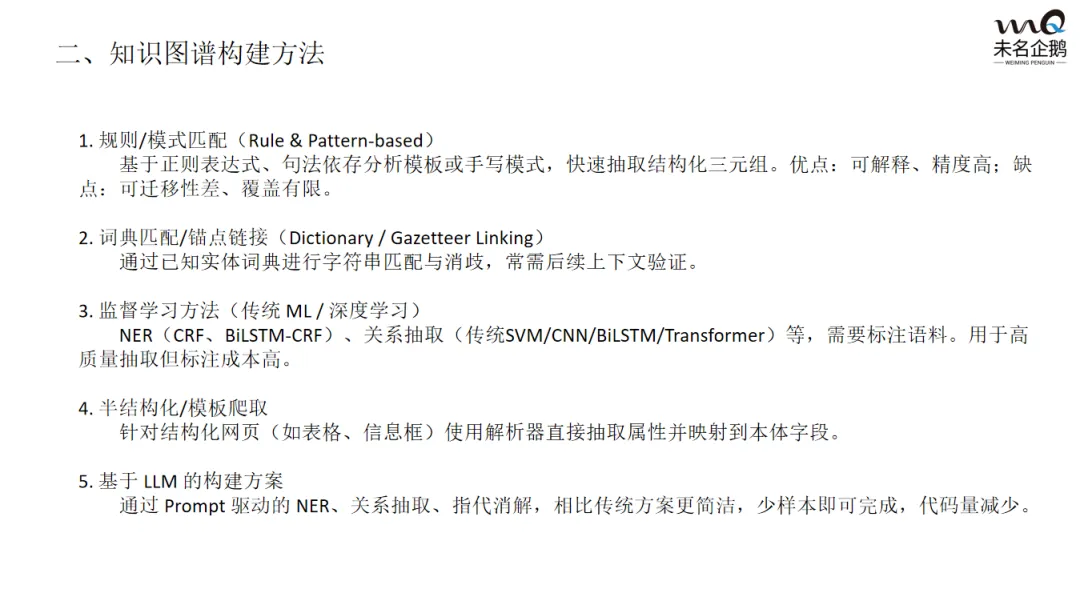
II. Knowledge Graph Construction Methods: From Traditional Approaches to New LLM-Based Paths

Image
Image

The presentation reviews five mainstream construction methods, focusing on a comparison of two core approaches:

• Traditional manual work plus automation: Offers high accuracy and is suitable for scenarios requiring strict rules, such as risk management;

• LLM-assisted construction: Significantly improves efficiency and suits rapidly evolving businesses such as retail and supply chains. It can reduce manual annotation costs and respond quickly to business needs.

Image


Whether technical professionals are building graph systems or business professionals are seeking to understand the value of these tools, they can find relevant guidance here. The presentation also offers direction for future iterations and applications of industry knowledge graphs.

Image
If your company faces digital transformation challenges or needs to build and apply knowledge graphs, visit Weiming Penguin's official website (www.tenez.cn) for more solution details, or follow our official WeChat account (wmpenguin) for the latest industry insights. To discuss potential collaboration, call our dedicated service hotline at 137-1791-5751, staffed from 9:00 to 18:00 on business days. We will provide one-on-one professional support to explore effective paths for pharmaceutical companies to advance AI-powered digital transformation.

2025318