Weiming Penguin Monday Data Coffee (1) | Behind 479,000 Designated Pharmacies: Five Provinces Account for Half of China's Total
Article images may contain Chinese text.

The Changing Landscape Behind a Number
479,908 pharmacies (still in existence). This is the total number of retail pharmacies designated under China's medical insurance system nationwide.
But what really deserves our attention is not the total; it is the following comparison:
Guangdong alone: 40,310, or 8.4% of the national total The entire Tibet Autonomous Region: 854, a fraction of Guangdong's total TOP4 provinces combined: 148,652, or 30.2% of the national total
What does this mean? Resources in the pharmacy channel are far more concentrated than you might expect. Distributing your products in just five provinces could already give you access to nearly half of China's retail outlets.
Data in Focus: The Pharmacy Landscape Across 31 Provincial-Level Regions
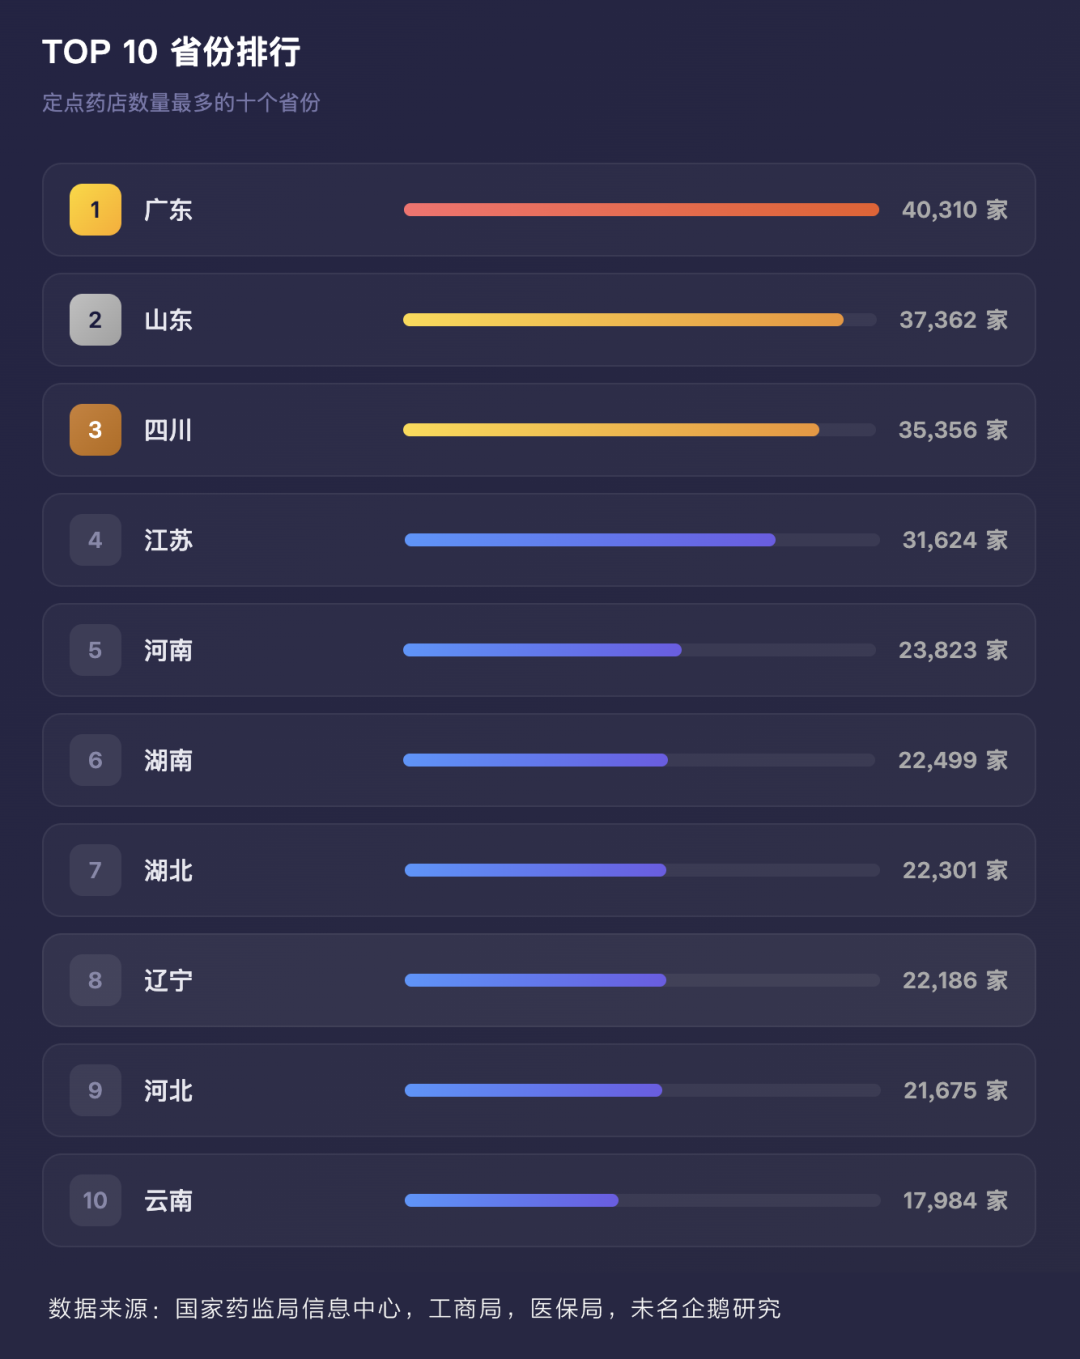
TOP10 Provinces
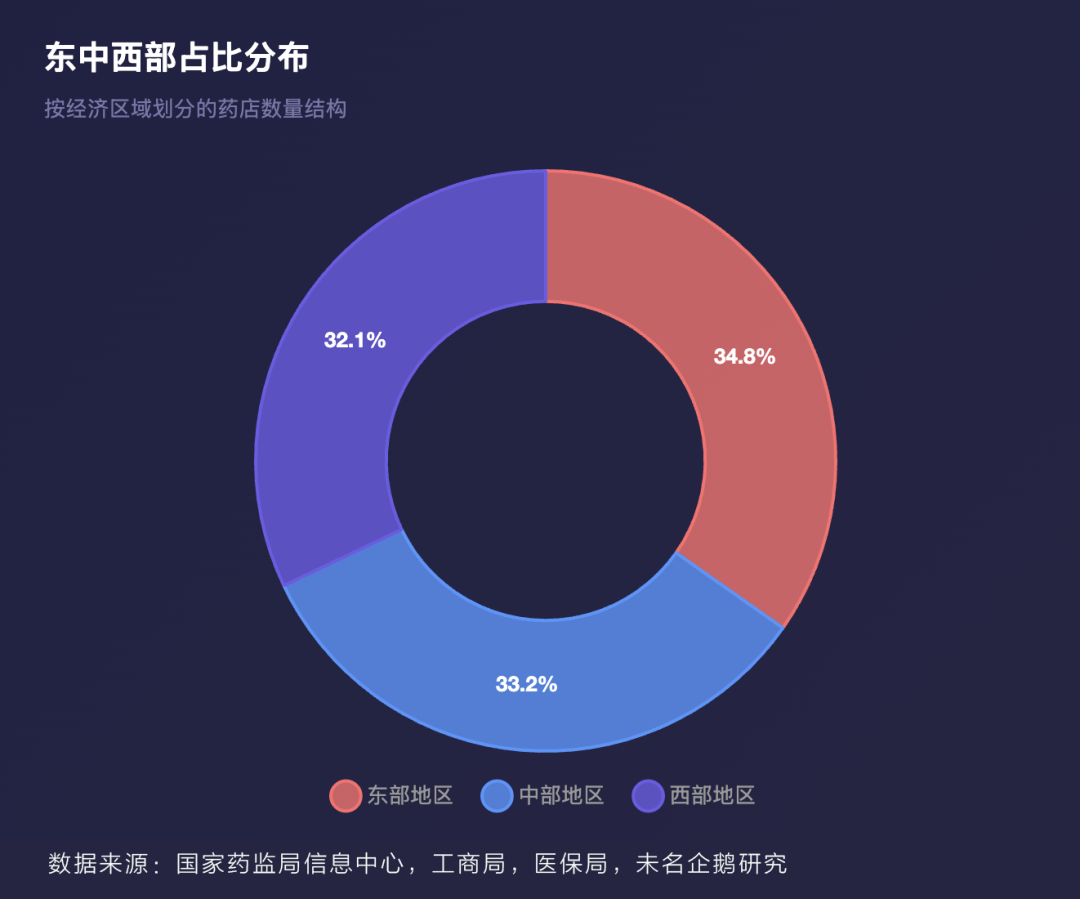
Comparing Eastern, Central, and Western China
Key finding: Central China has the highest average density per province. Henan, Hunan, Hubei, and Anhui have the fiercest pharmacy competition, but this also puts heavy pressure on revenue per store—your products' ability to sell through at retail outlets in these regions can make or break them.
Want to know which provinces your competitors are most deeply established in? Scan the QR code below to contact Weiming Penguin. Explore data on 479,908 designated pharmacies with one click and give your channel decisions a solid evidence base.

Email:contact@tenez.cn
Phone:13717915751
Data Appendix
TOP10 Provinces
| Rank | Province | Number of Designated Pharmacies | Share of National Total |
| 1 | Guangdong Province | 40,310 | 8.4% |
| 2 | Shandong Province | 37,362 | 7.8% |
| 3 | Sichuan Province | 35,356 | 7.4% |
| 4 | Jiangsu Province | 31,624 | 6.6% |
| 5 | Henan Province | 23,823 | 5.0% |
| 6 | Hunan Province | 22,499 | 4.7% |
| 7 | Hubei Province | 22,301 | 4.6% |
| 8 | Liaoning Province | 22,186 | 4.6% |
| 9 | Hebei Province | 21,675 | 4.5% |
| 10 | Yunnan Province | 17,984 | 3.7% |
Comparing Eastern, Central, and Western China
| Region | Number of Provinces | Total Number of Pharmacies | Share | Average per Province |
| Eastern China | 10 | 166,819 | 34.7% | 16,682 |
| Central China | 9 | 159,177 | 33.2% | 17,686 |
| Western China | 12 | 153,912 | 32.1% | 12,826 |
About the Series
Monday Data Coffee is produced by Weiming Penguin. Every Monday at 8 a.m., when you open WeChat, a cup of “Data Coffee” is already waiting for you. With 52 editions/year, these concise, frequent updates let you take the pulse of the industry on your commute.
Core value: One cup a week to refresh your mind, using high-value data to spark deeper thinking about the industry.
Source: Weiming Penguin Retail Outlet Dictionary. Corrections to any errors or omissions are welcome!
Disclaimer: This article is intended solely to share pharmaceutical information and does not constitute investment advice or recommendations for decision-making.
Next Cup Preview | China's New 2026 Medical Insurance Rules Take Effect: The Logic of Channels Is Being Rewritten
Policy takes effect on April 1; the market reshuffles within three months. Progress across 31 provincial-level regions and the capacity of top pharmacy chains to take on new business—next Monday at 8:00, the data will tell the story.